An Integrated Approach to SD-WAN Visibility – Avoiding Blind Spots
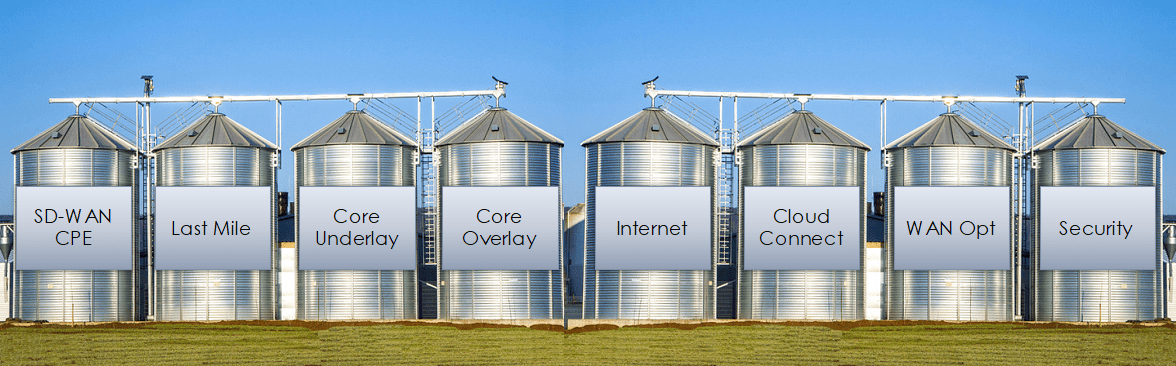
Too often, SD-WAN deployments don’t take into account the application and network visibility required to make the most of the service; to ensure optimal performance and to drive maximum productivity gains. This is especially true with overlay SD-WAN, where control of the underlying physical infrastructure is under the control of a carrier, for example, while the SD-WAN overlay is monitored by the enterprise. This is further complicated by other elements of the SD-WAN, including the CPE, WAN optimization, security, and cloud connectivity, each of which may have different management interfaces.
The result is a siloed architecture with potential blind spots that prevents true end-to-end visibility and effective troubleshooting. We expect the carrier’s SD-WAN manager to have familiarity with these various service and technology components to break through these silos, but this is more easily said than done.
What do we require with visibility?
If we look at a typical SD-WAN deployment, there are many moving parts, most hopefully shielded from enterprise IT who are looking to SD-WAN for operational simplicity, and not the other way around. Beginning with the SD-WAN edge CPE, next is the last or first-mile, then the PoP, core connectivity, and any internet links. Next are connections to the different cloud services, optimization, and both edge and cloud security.
The goal of any visibility architecture is both configuration management as well as consumption tracking, and quick root cause analysis. The first is how IT defines its use of the SD-WAN, such as application prioritization, and needs to be based on simple and intuitive graphical workflows. The second is where troubleshooting comes into play, quickly identifying any issues while helping IT verify their SLAs.
To be effective, the SD-WAN orchestration must offer global multi-layer visibility, able to immediately identify any underlying network issues that impact subscriber traffic. With an MPLS overlay across a routed infrastructure, this is an indirect operation, sometimes managed by different organizations. Due to limitations in many MPLS deployments, cloud connectivity follows a different path, many times from an organization’s HQ or data center. This too requires a separate management interface.
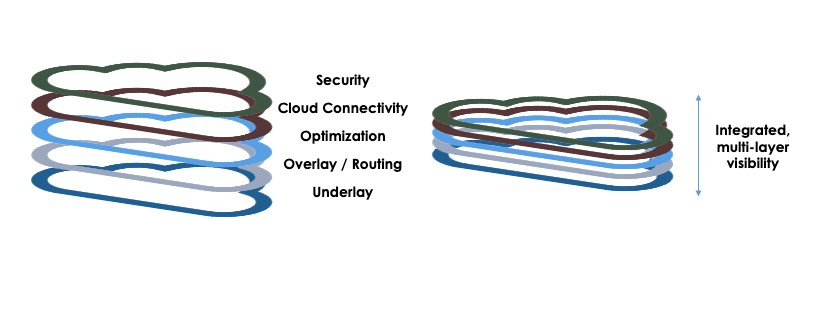

Multi-Layer WAN Visibility
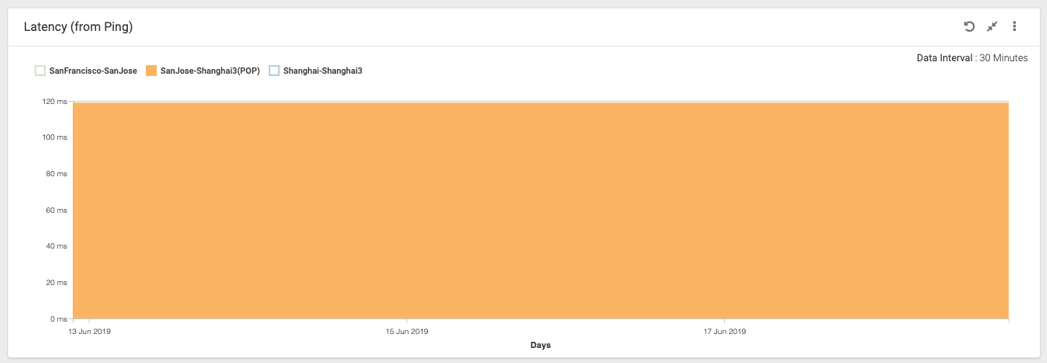
An integrated offering enables the types of rock-solid performance guarantees, as in the chart below that depicts deterministic latency from San Jose, CA to Shanghai. Monitoring must also include what types of applications are in use, and when, optimization, as well as being able to verify SLAs, such as tracking connection setup time. The table on the left lists the various monitorable parameters. One of the most important items for monitoring, though sometimes overlooked, is the last-mile that traverses one or more ISPs. Proactive, around-the-clock monitoring must include link status, any packet loss, latency, and jitter.
Latency Analysis
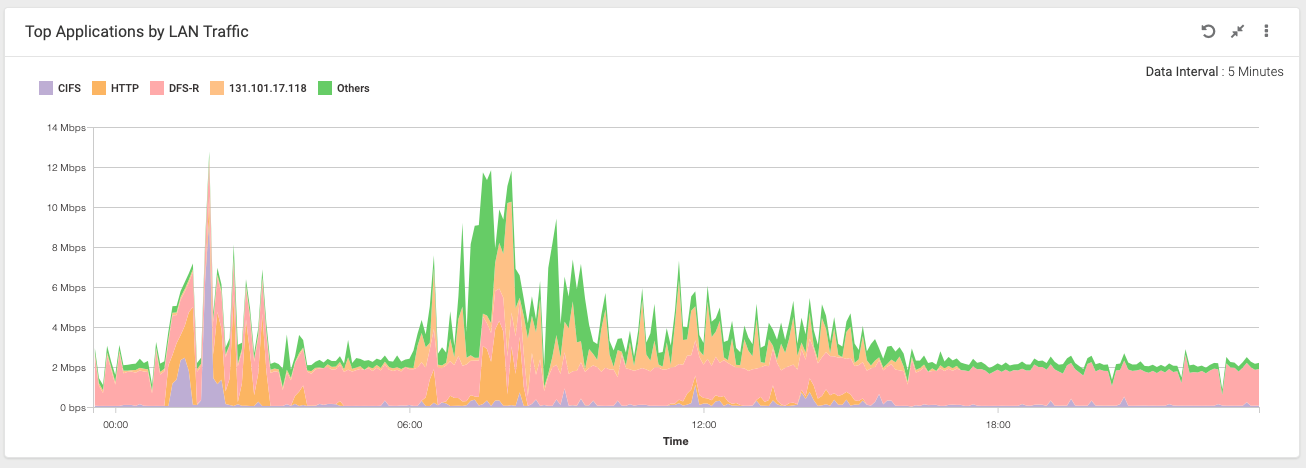
Application Type Analysis
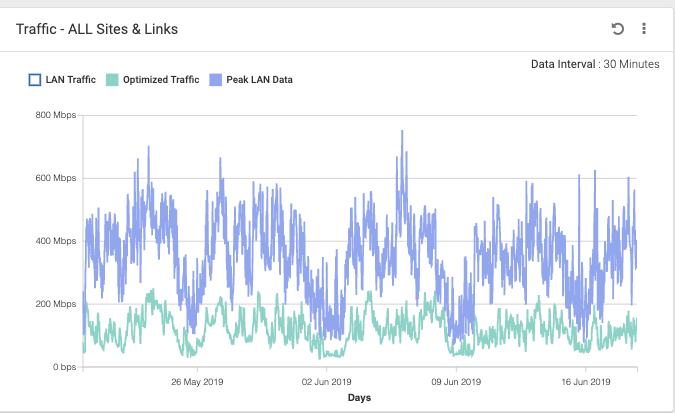
Optimization Analysis
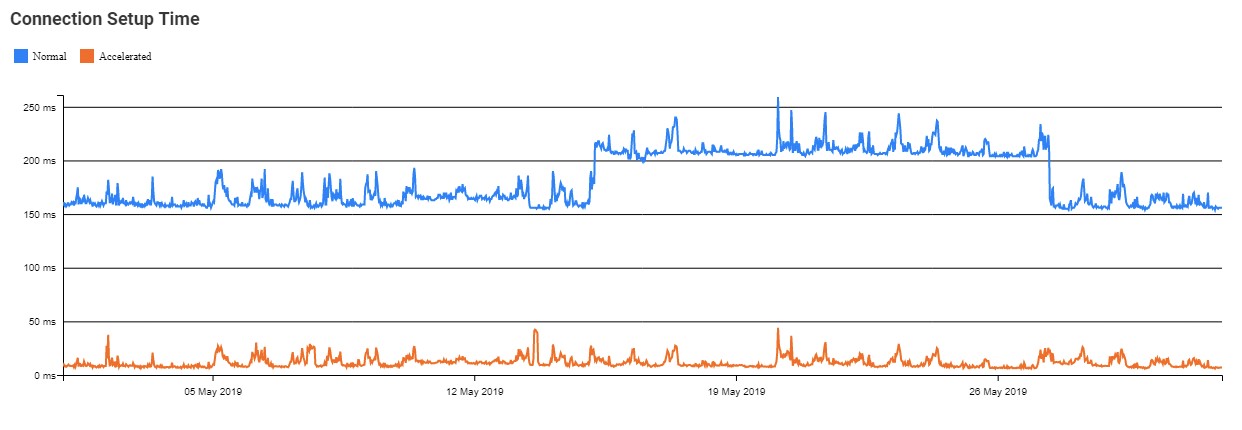
Connection Setup Time Analysis
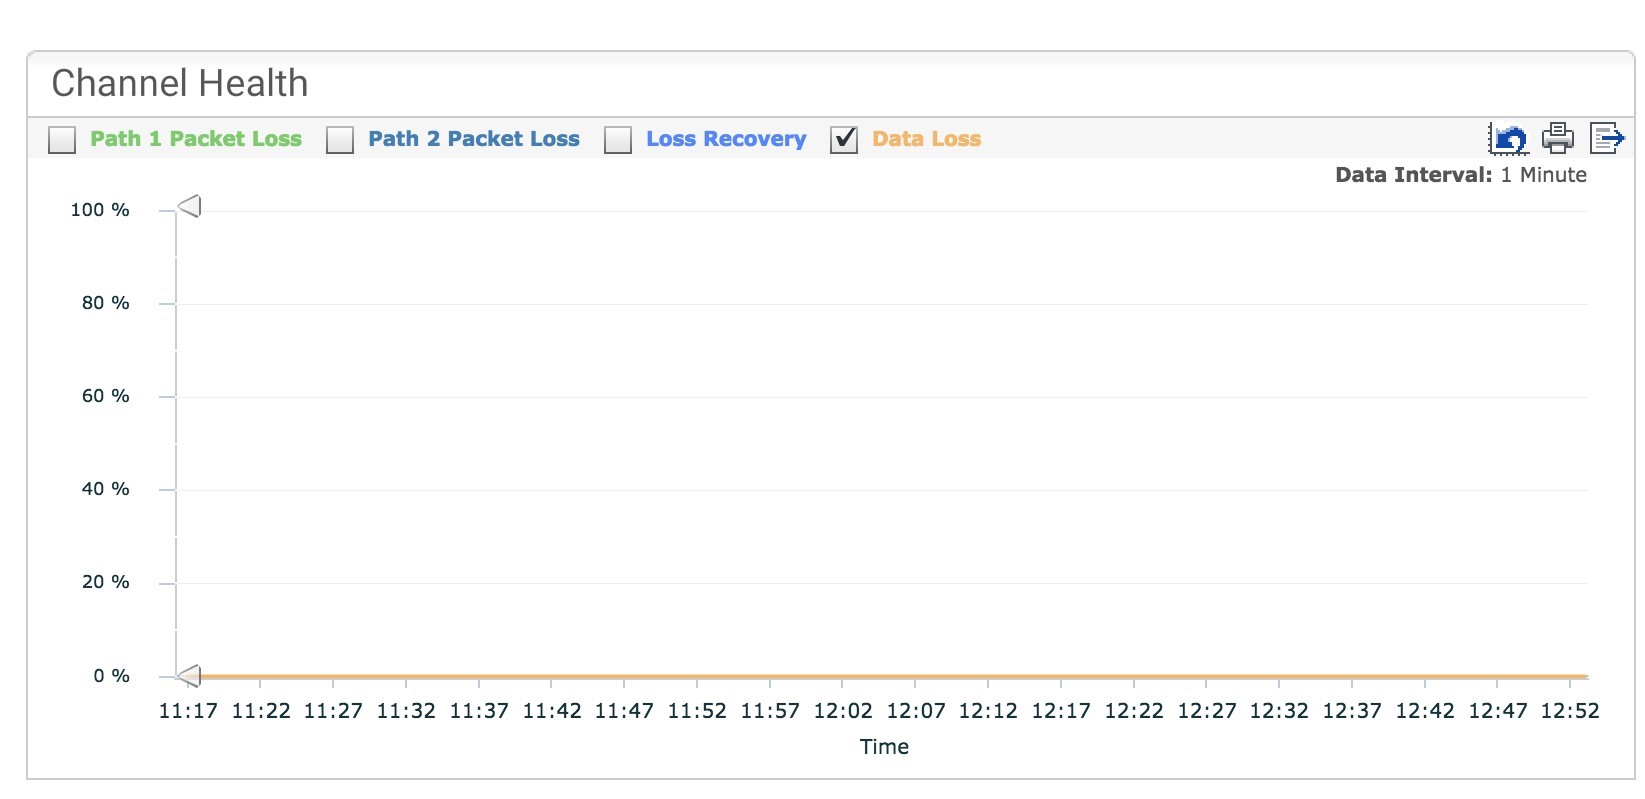
One advantage of last-mile monitoring is being able to intelligently track any packet loss against multiple links, with a goal of creating an error-free connection by correlating loss between the two. This is depicted below, with each link both exhibiting some loss. However, last-mile link intelligence is able to compensate for this, and from the standpoint of the SD-WAN edge, the link is error-free.

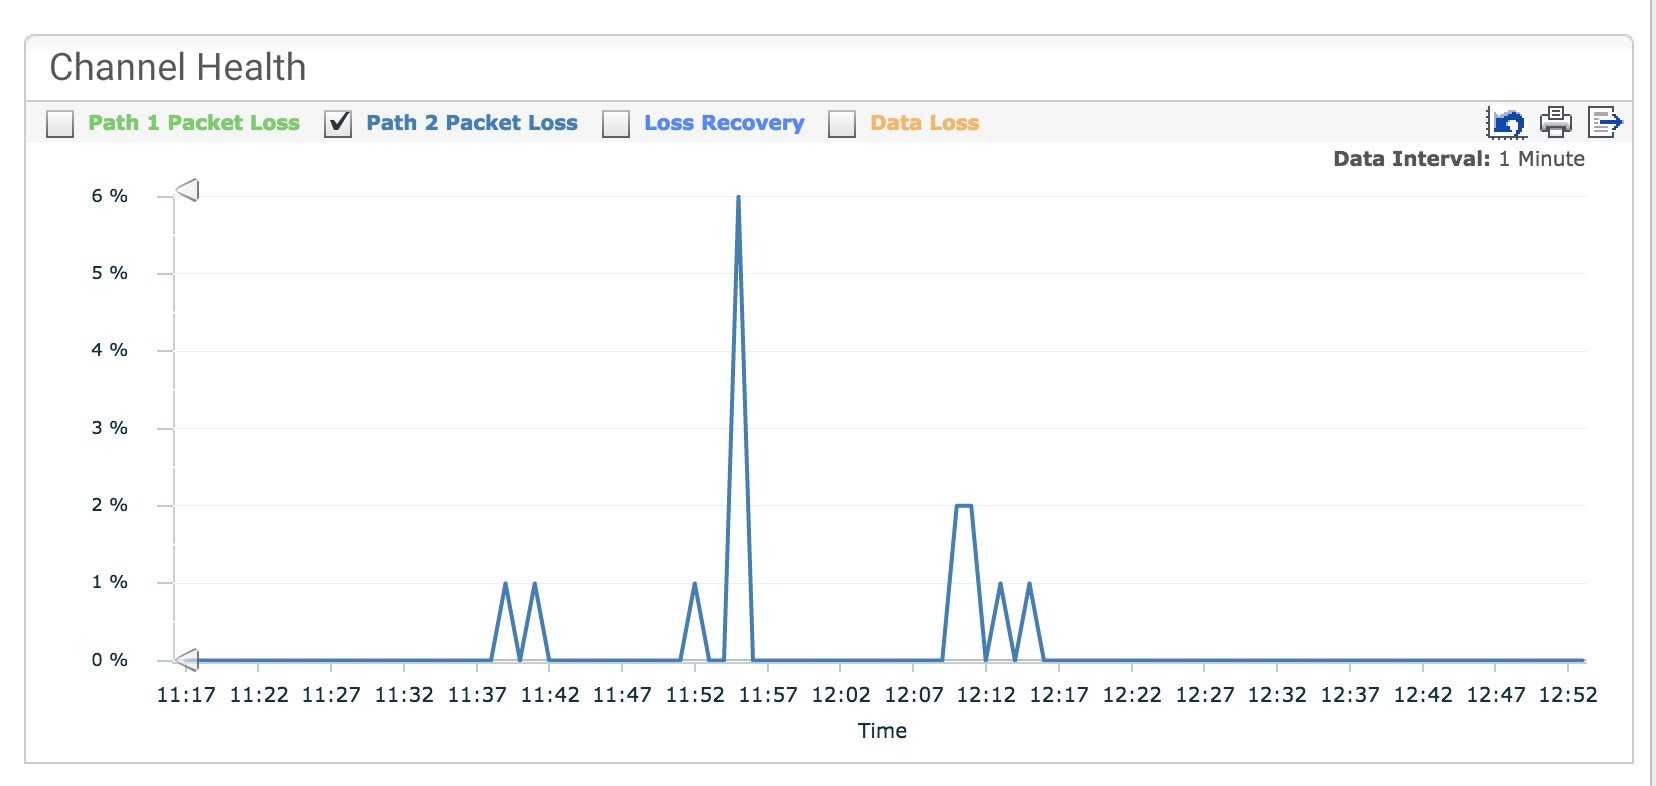
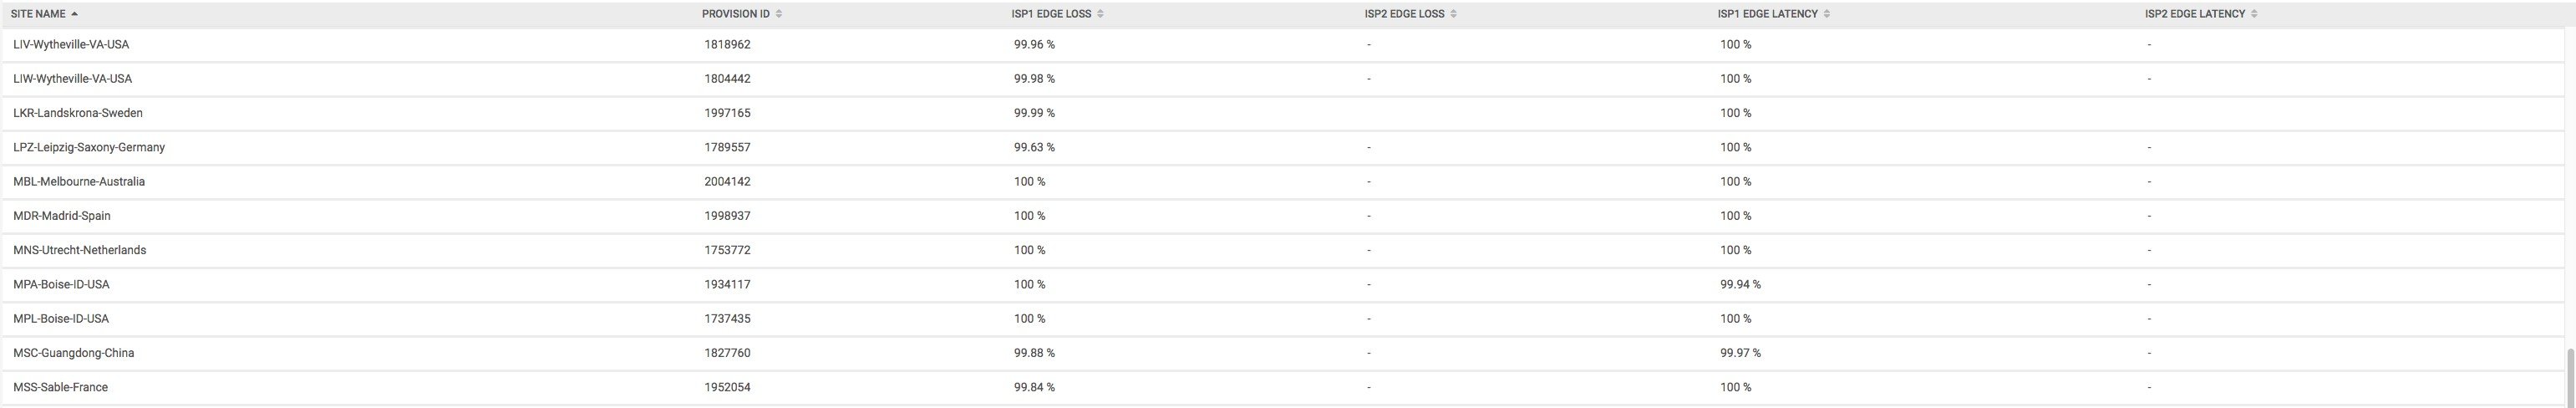
The above capability can help counter last-mile ISP loss, as captured in the table below.
All Aryaka solutions include global access to the web-based MyAryaka portal. The MyAryaka customer portal offers deep, end-to-end network and application visibility for your business. MyAryaka provides tailored dashboards to help CIOs and Network Managers gain visibility into applications, service use and performance. It includes reporting on:
- LAN and WAN utilization across locations and per application
- TCP connections intercepted and bypassed across locations
- Latency measurements across multiple network segments
- TCP connection setup time
- Compression and Deduplication across applications and locations
- Drill down into CIFS data traversing the network and related data reduction
- QoS Parameters set to weight, prioritize and reserve traffic
- Network Health reports
- Cache hit ratio and Origin Offload for Web Content Delivery
- Traffic by country and by POP for Web Content Delivery
- Customized reports per application, per branch and per port to track performance
- Network customization to add or remove enterprise locations as and when required
Additionally, MyAryaka also enables users to:
- Track changes in the configuration of the network
- Troubleshoot and resolve issues using detailed reports
- Generate periodic alerts and fault management
- Track SLA compliance
- Track customer support progress
- Obtain end-to-end visibility and control
View On-Demand Webinar
- Accelerate CAD/CAM Performance
- Improve Zoom Conferencing Performance
- Calypso Embraces a SaaS-first Strategy
- CallisonRTKL Transforms their WAN
- Kleinfelder Improves Application Performance
- Teradyne Transforms their WAN
- SAP web application performance
- Kleinfelder Improves Application Performance
- Industrial Manufacturing Company Transforms WAN
About the author