The State of the Global Enterprise WAN 2015: 5 Trends for CIOs and Network Managers to Watch
Last week, we released our State of the Enterprise WAN Report 2015. This year’s report investigates key factors impacting the evolution of the enterprise WAN, including the ongoing migration of applications to the cloud, the limitations of the public Internet over long distances, and the impact of networking problems on application performance.
Here’s a glimpse into some of the most significant trends that will impact CIOs, IT Directors, Network Architects, and Network Managers, as the global enterprise WAN evolves in 2015.
If you would like to re-publish this infographic on your own website or blog, please use the embed code below!
|
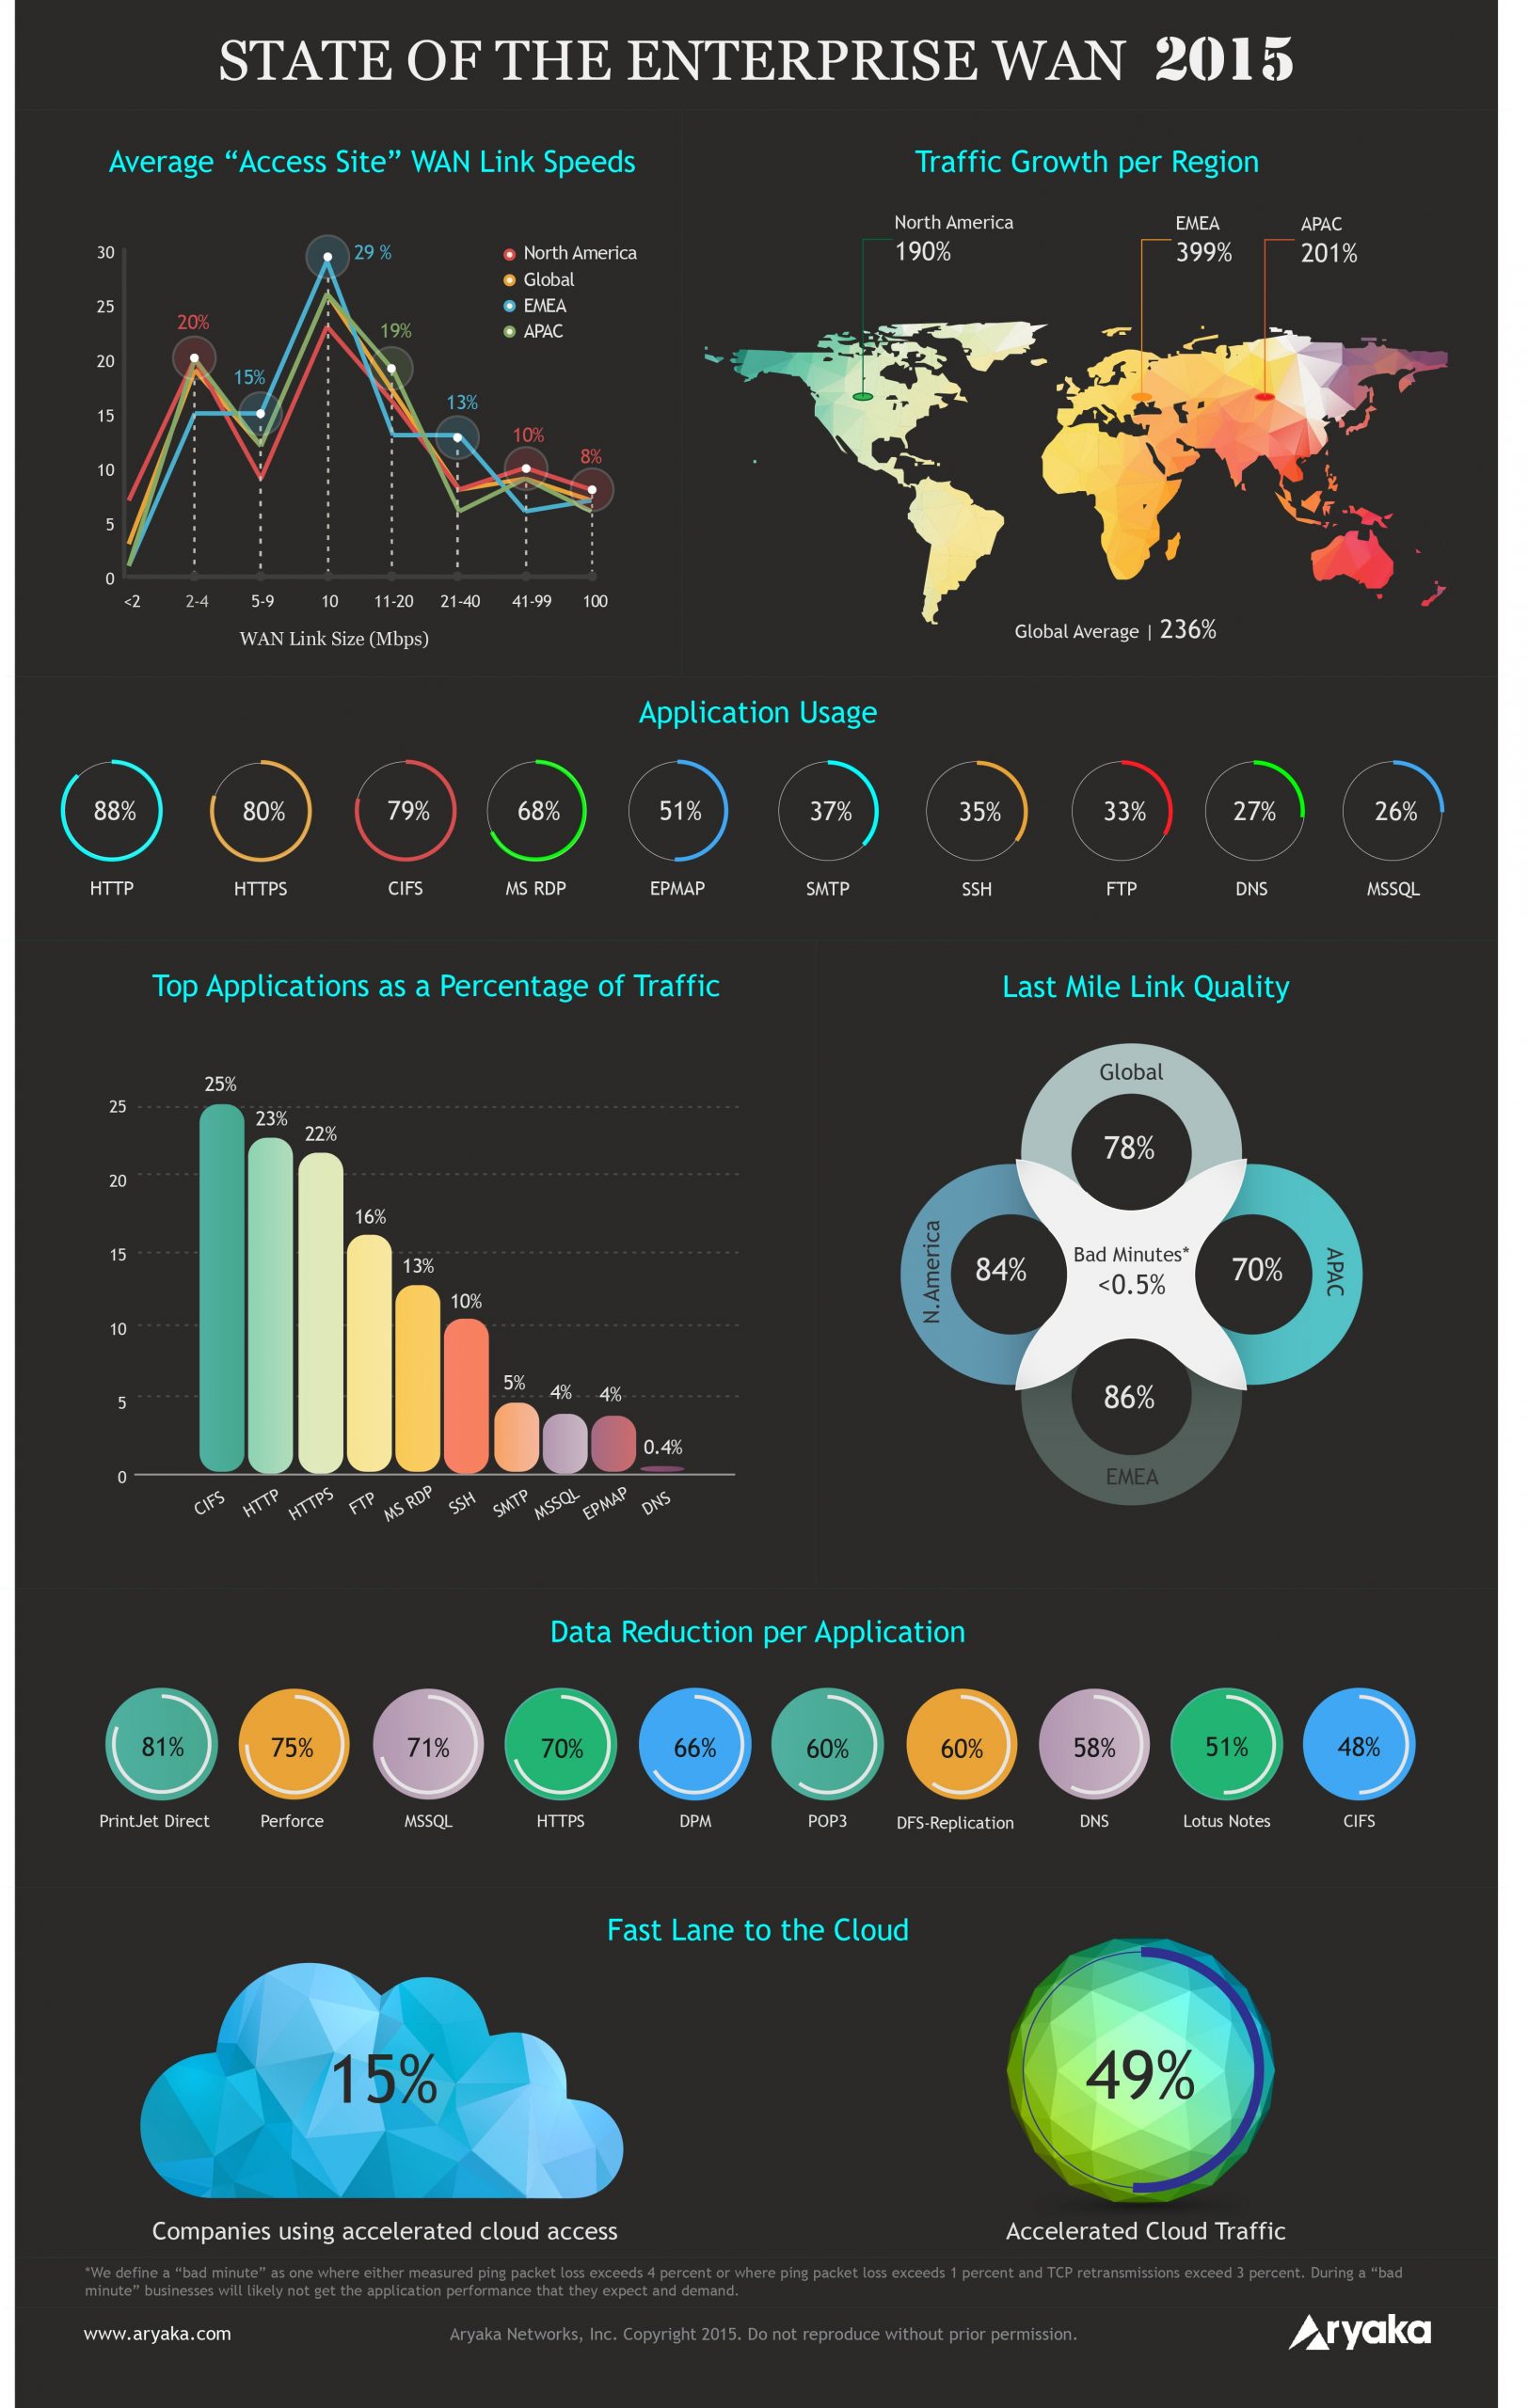
- Global enterprise traffic grew at a mean rate of 236%, in 2014. Enterprise traffic in EMEA grew the fastest at a mean rate of about 399%; traffic in APAC grew 201%, while traffic in North America grew 190%.
- First- and last-mile links are improving globally. 67% of our enterprise customers globally use a high-speed Internet link (greater than or equal to 10 Mbps) for their last mile. 16% of them use very-high-speed Internet edge links (greater than 40 Mbps). EMEA locations have the highest percentage of high-speed access site last-mile WAN links. However, owing to the improved quality of last-mile links globally, EMEA now lags behind the global average for very high-speed WAN links. North American access sites, while lagging behind EMEA slightly in regards to high-speed last-mile links, actually have a higher percentage of very high speed links.Compared to last year, APAC has seen a substantial growth in very-high-speed WAN links, even surpassing EMEA and the global average. A full 21% of APAC sites have links >20 Mbps, up from 14% last year. Another thing to note in APAC is that many sites (about 33%) still have low-speed connections of less than 10 Mbps. This indicates a huge amount of disparity among enterprises with offices in APAC.
- Enterprises typically see less than 0.25% packet loss over the last-mile link, even in emerging markets like China and India. The global median packet loss is a mere 0.04%. Globally, 78% of our customer sites experienced <0.5% bad minutes on the last mile. As one might expect, the percentage of sites experiencing a relatively large amount of bad minutes in regions like North America and EMEA is low. However, over longer distances, the public Internet is far from business-grade, since network problems in the middle mile tend to kill application performance.
- HTTP traffic continues to dominate – pointing towards heavy cloud adoption rates. 88% of our enterprise customers send HTTP traffic over the WAN, while 80% of them send HTTPS. 79% of our enterprise customers send CIFS traffic over the WAN; 68% are MS remote desktop users; 37% use SMTP; 35% use SSH; 33% use FTP, and 17% use Citrix.
- Among the many techniques leveraged in WAN Optimization solutions, data deduplication, compression, and caching account for a sizeable reduction in data flowing across a WAN pipe. Using these technologies, WAN Optimization vendors are able to provide not just bandwidth savings, but also the ability to accelerate application performance. Despite the talk around more application data being encrypted or pre-compressed, many protocols, including CIFS, HTTP, IMAP, and MSSQL, can still see bandwidth usage savings of 50% or more.With the right optimization technologies in place, data reduction can help enterprises keep up with skyrocketing bandwidth demands, at least in the short term. In the longer term, more advanced, unified approaches will be needed. Another noteworthy point here is that certain applications are far more compressible than others. Perforce, for instance, sees an average data reduction of 75% over our network.
- Accelerate CAD/CAM Performance
- Improve Zoom Conferencing Performance
- Calypso Embraces a SaaS-first Strategy
- CallisonRTKL Transforms their WAN
- Kleinfelder Improves Application Performance
- Teradyne Transforms their WAN
- SAP web application performance
- Kleinfelder Improves Application Performance
- Industrial Manufacturing Company Transforms WAN